
Advanced statistics module
Advanced statistics for public services
Manage your public services with clear, reliable, ready-to-use dashboards.
Track your indicators in real time to adjust your actions, optimize your resources and serve citizens better.
The challenge
Too many numbers, not enough decisions? You are not alone.
What still holds back the management of your services.
- Scattered data that is hard to use
Each department works with its own tools. The result: figures you cannot find, manual reports and overwhelmed staff.
- No overall view in real time
Without a dashboard, there is no way to anticipate resident demand or optimize how resources are allocated.
- Reports too complex to be used
Unreadable data, indicators disconnected from issues on the ground, and elected officials left in the dark.

Features
What do the dashboards and key statistics offer?
What you can track, analyze and improve from the very first month.
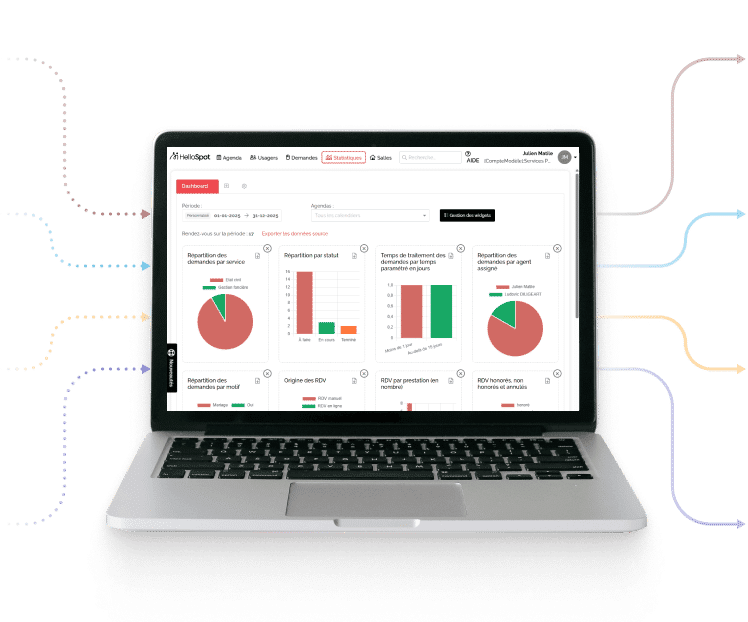
- Number of appointments by department, by staff member, by week
- No-show and missed appointment rates
- Average time spent per type of request
- Attendance compared by period or by channel
- Workload distribution across staff
- CSV and PDF exports, plus a summary for the municipal council

Before / after
Your challenges, our answers
A real management tool, not just a reporting tool.
Before
- You spend hours compiling figures.
- Your teams do not know how to interpret the data.
- You have nothing to show elected officials.
- You run your services blind.
With HelloSpot
- Automatic, consolidated reports.
- Clear visuals and an intuitive interface.
- Dashboards you can share in 1 click.
- Real-time indicators, and the ability to plan staffing.
Attendance data
Optimize and streamline the handling of citizen requests
Attendance data is analyzed to improve appointment management and lower no-show rates.

And also
The module at a glance
-
Automatic reports
Clear reports tailored to your needs, with no effort: the key data from your services to manage better, plan ahead and report back.
-
Decision-making support
Concrete data to decide quickly, wisely and in line with the realities of public service.
HelloSpot in numbers
-
10
years of experience
Since 2016, HelloSpot has become a key partner of public service organizations.
-
700
customers
HelloSpot supports more than 700 public services across France.
-
4,000
staff users
Our platform is used by more than 4,000 staff members across many local authorities, for efficient, centralized management.
-
1M
procedures
HelloSpot has supported more than 1,000,000 administrative procedures, a sign of the trust and satisfaction of our customers and of the public.
Customer reviews
A real impact on your organization, every day
Take back control of requests between residents and your departments, for free
-

Allaire Town Hall
We chose HelloSpot to reduce the number of phone calls. The software makes life easier for residents and has sharply cut the number of calls. We are very satisfied with both the software and the team’s responsiveness.
-

Bouillargues Town Hall
With the sharp rise in ID document applications, our Excel spreadsheet was no longer enough for booking appointments. HelloSpot gives us better visibility over our organization and saves us a considerable amount of time.
-

Craponne Town Hall
It saves time with online appointment booking and sending the list of required documents. The e-mail reminder the day before means very few missed appointments.
-

Thann Town Hall
We are really satisfied with HelloSpot and we will not go back.
FAQ
Frequently asked questions
-
Are reports generated automatically?
Yes. You regularly receive concise, visual reports with no manual action. They can be scheduled, exported and easily shared with your teams or elected officials. -
Can we filter or cross-reference the data?
Absolutely. You can cross-reference data by department, period, contact channel or type of request. This gives you a detailed reading of performance and needs. -
What is the concrete benefit for the local authority?
Objective, responsive management. You quickly identify bottlenecks, adjust your resources and improve quality of service. The data also strengthens transparency and makes dialogue with elected officials and citizens easier. -
Can statistics be exported individually or in full?
Yes. The advanced statistics tool lets staff export data as they need. You can extract targeted reports on a specific indicator or period, or all available statistics for an overall analysis. -
Are the statistics easy to access?
Yes. Statistics are a few clicks away in your interface. Fully customizable, they let you track the data that really matters to your local authority: volumes, lead times, reasons, breakdown by department, and much more.
Page updated on January 7, 2026.
News & blog
Discover our latest innovations
-

October 27, 2026
Tight budget: what you can modernize without a public procurement contract
-

October 20, 2026
Front desk statistics: the three figures that move an organization
-

October 13, 2026
Monday morning at the front desk: smoothing the peaks without longer opening hours
-

September 30, 2026
Budget 2027: serving residents better while freeing up room in the budget
-
September 14, 2026
Op-ed in Décideur Public: AI has already entered town halls through the window
-

July 3, 2026
Heatwaves: how to modernize your municipality's register of vulnerable people

CONTACT
Make informed decisions: clear, detailed statistics reports.
See the key data from your services at a glance to manage better, plan ahead and report back.
By clicking the button, you accept our privacy policy.